This file contains:
(1) a list of slide titles (hyperlinked), and
(2) the contents of each slide.
A pdf version of the talk is
available here
Sudbury 1-1-623
telephone 978-440-1660
Daniel_I_Zwillinger@raytheon.com
http://www.mathtable.com/zwillinger/talks/20010613/
This course will expose users to the Matlab software language. The language will be described at a high level. Matlab's capabilities (data types, programming constructs, functions, toolboxes, and graphics) and how users tend to use them will be discussed. A discussion of when to use Matlab will be given. A demonstration will be given.
``Like every other scripting language, Matlab began as a simple way to do powerful things, and it has become a not-so-simple way to do very powerful things.''
2
![]()
![]()

>> A=zeros(2,2)
A =
     0     0
     0     0
>> B=ones(3,2)
B =
     1     1
     1     1
     1     1
>> C=eye(3)
C =
     1     0     0
     0     1     0
     0     0     1
>> D=[1 2; 3 4]
D =
     1     2
     3     4
>> s= 1:4
s =
    1    2    3    4
>> s2= 1:2:7
s2 =
    1    3    5    7
>> s3= 1:.5:2
s3 =
  1.0000  1.5000  2.0000
>> r=rand(2,3)
r =
   0.47   0.85   0.20
   0.42   0.53   0.67
>> r(:,1)
ans =
   0.47
   0.42
>> r(:,1)'
ans =
   0.47   0.42
>> A=zeros(2,2);
>> B=ones(3,2);
>> C=[ [A;B], [B+5;A-7] ]
C =
     0     0     6     6
     0     0     6     6
     1     1     6     6
     1     1    -7    -7
     1     1    -7    -7
>> C(:,[1 4])
ans =
     0     6
     0     6
     1     6
     1    -7
     1    -7
>> log( 1 )
ans =
     0
>> log( [1 2] )
ans =
         0    0.6931
>> log( [1 2; 0 NaN] )
Warning: Log of zero.
ans =
         0    0.6931
      -Inf       NaN
| Input | Output | |
| u<3 | [1 1 0] | |
| all(u<3) | 0 | |
| any(u<3) | 1 | |
| find(u<3) | [1 2] |
>> a = eye(4) + 0.01*rand(4,4)
a =
    1.0095    0.0089    0.0082    0.0092
    0.0023    1.0076    0.0044    0.0074
    0.0061    0.0046    1.0062    0.0018
    0.0049    0.0002    0.0079    1.0041
>> eig(a)
ans =
   1.0232
   1.0009 + 0.0046i
   1.0009 - 0.0046i
   1.0023
x=inv(A) * b
or
[L,U,P]=lu(A)
x=inv(U) * inv(L) * P * b
or
x=A![]() b
b
or
...
>> A=rand(3,2)
A =
    0.7095    0.1897
    0.4289    0.1934
    0.3046    0.6822
>> b=rand(3,1)
b =
    0.3028
    0.5417
    0.1509
>> soln=A\b
soln =
    0.6387
   -0.0121
![]() Sparse matrices
Sparse matrices
>> A=speye(100000,100000);
>> A2=2*A;
>> A2(4,5)=5;
>> nnz(A2)
ans =
       100001
![]() Multidimensional arrays
Multidimensional arrays
>> r=rand(2,2,3)
r(:,:,1) =
    0.1389    0.1987
    0.2028    0.6038
r(:,:,2) =
    0.2722    0.0153
    0.1988    0.7468
r(:,:,3) =
    0.4451    0.4660
    0.9318    0.4186
>> i=0;
>> for t=0:0.001:10
      i=i+1;
      y(i)=sin(t);
   end
>> time1=toc
time1 =
    0.1936
>> t=0:0.001:10;
>> y=sin(t);
>> time2=toc
time2 =
    0.0111
>> time1/time2
ans =
   17.4677
| ans | most recent result |
| eps | machine epsilon |
| flops | total floating point ops during session |
| i,j | |
| inf | |
| NaN | not-a-number |
| pi | |
| realmax | largest positive floating point number |
| realmin | smallest positive floating point number |
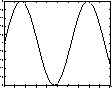
>> x=0:.1:10;
>> y=sin(x);
>> plot(x,y)
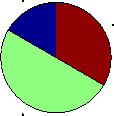
>> data=[2 6 4];
>> text={'a','b','c'};
>> pie(data,text)
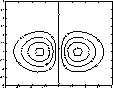
>> [X,Y]=...
    meshgrid(-2:.2:2,-2:.2:3);
>> Z = X.*exp(-X.^2-Y.^2);
>> [C,h] = contour(X,Y,Z);
>> clabel(C,h)
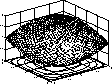
>> t=0:.1:10;
>> x=sin(t);
>> y=cos(t);
>> z=x'*y;
>> meshc(x,y,z);
>> format +
>> A=random(5,15)-1/2
A =
++--+++-+++++-+
+-+---+-++-+++-
-++--+-+--+-+--
+-+--+---+++---
-+-++-----+--+-
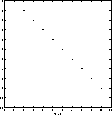
>> B=zeros(10,10)
>> for i=1:9
>>    B(i,i+1)=2;
>> end
>> spy(B)
![\fbox {\begin{minipage}
{0.98in}
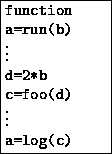
\texttt{function e=foo(f,g)}\\ $\vdots$\\ \texttt{[h,i]=bar(f)}
\\ $\vdots$\\ \texttt{e=sqrt(h)}
\end{minipage}}](matlab_img18.gif)
![\fbox {\begin{minipage}
{1.19in}
\texttt{function [j,k,l]=bar(m)}\\ $\vdots$\space \\ \texttt{j=m} \\ \texttt{k=2*m}\\ \texttt{l=m*m}
\end{minipage}}](matlab_img19.gif)
![]() Have variables nargin and nargout
Have variables nargin and nargout
![]() Frequently have many short files
Frequently have many short files
GNU Octave is a high-level language, primarily intended for numerical computations. It provides a convenient command line interface for solving linear and nonlinear problems numerically, and for performing other numerical experiments using a language that is mostly compatible with Matlab. It may also be used as a batch-oriented language.
Octave has extensive tools for solving common numerical linear algebra problems ...It is easily extensible and customizable via user-defined functions written in Octave's own language, or using dynamically loaded modules written in C++, C, Fortran, or other languages.
GNU Octave is also freely redistributable software. You may redistribute it and/or modify it under the terms of the GNU General Public License (GPL) as published by the Free Software Foundation.